HTTP Debugger Overview
HTTP Debugger is a professional http sniffer for intercepting and analyzing the http protocol traffic between a web browser or any application using the HTTP / HTTPS protocol, and a web server.
With HTTP Debugger you can locate and fix website errors and identify performance bottlenecks; analyze http headers, query strings, cookies, redirections, authorization headers, POST parameters and error codes; view the source code of HTML/XML web pages and Java/VB scripts. You can use HTTP Debugger to analyze the http traffic produced by web browser add-ons, ActiveX components and/or Java applets.
Software developers can use the HTTP Debugger to view and analyze the http traffic of their own, or any third party, software programs in C#, Java, VB, C++, Delphi, regardless of whether it is a user mode application or a Windows System Service.
What I need to use the HTTP Debugger?
The HTTP Debugger supports Microsoft Windows 2000/XP/2003/Vista and Windows 7. It does not require any special software to be installed onto your computer; neither Java Virtual Machine nor the .NET Framework components.
You can download the Free 14-day Trial version of program from our website at https://www.httpdebugger.com web site. The trial version of HTTP Debugger is a full functional version working without any limitations for 14-days from the moment that you install the application on your computer.
Key Features
Full support of both 32-Bit and 64-Bit applications
HTTP Debugger fully supports both 32-bit and 64-bit applications. Simply run HTTP Debugger on your 64-bit computer and see the HTTP traffic from both 32-bit and 64-bit applications in one single HTTP Debugger window!
Support of Any Web Browser and Low-Level System Components
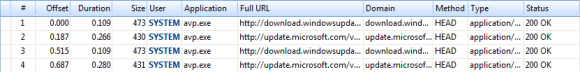
HTTP Debugger automatically supports any web browser (Internet Explorer, Mozilla Firefox, Opera, Safari, Google Chrome) or any other application running on all Microsoft Windows operation systems and using the HTTP protocol including, for example, anti-viruses database update and/or any running low-level system component.
Decoding of HTTPS/SSL Connections
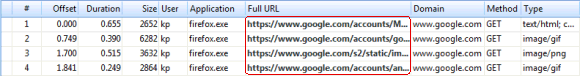
HTTP Debugger automatically decrypts the secure HTTPS sessions for Google Chrome, Mozilla Firefox, Internet Explorer and other programs allowing debugging websites in the secure mode without switching the HTTPS off.
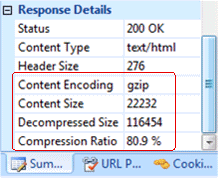
Decoding of gZip/Chunked Content
The gzip/chunked content is processed automatically. On the Summary Pane you can view full details on the used compression method and ratio.
Support of Dial-up Modem, DSL/ISDN/Cable/LAN Connections
HTTP Debugger intercepts the HTTP/HTTPS traffic regardless of Internet connection type and speed. The HTTP Debugger will work perfectly with a fast optical fiber Internet connection, an Ethernet cable or even an old dial-up modem.
Monitoring All TCP/IP Ports, Not Only Port 80
HTTP Debugger does not rely only on standard port 80, it automatically captures the HTTP traffic for all ports.
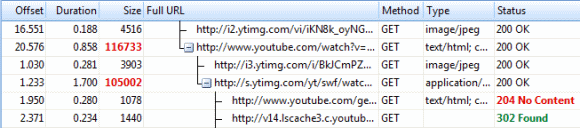
Tree and Flat List Modes
HTTP Debugger has two presentation forms for the main list; flat list view mode and advanced tree view mode.
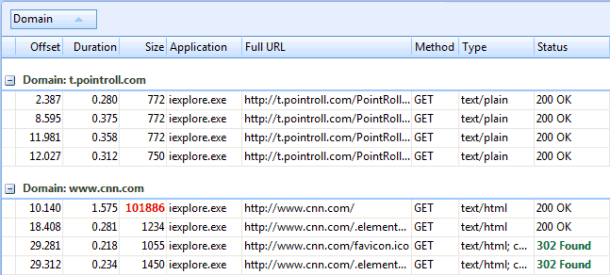
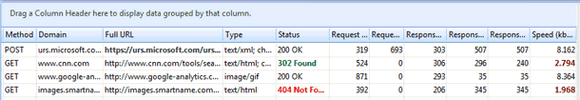
Grouping and Sorting Data
Working with HTTP Debugger you can group the captured data by various parameters. Simply drag the Column Header to the Group By box. Sorting the data is as easy as clicking on the appropriate Column Header.
Advanced Search
Using the Search you can easily locate http transactions containing the sought text in the http header and/or content.
Advanced Filtering
Using HTTP Debugger Advanced Filtering, you can hide the unneeded data. The filtering rules can be applied for URLs, HTTP methods, referrers, authorization headers, and cookies, user name, application EXE name, etc.
Read more about HTTP Filter.
Advanced Highlighting
Using HTTP Debugger's Advanced Highlighting you may emphasize attention on website data not performing properly, for example: the downloading speed may be very slow. The HTTP Debugger comes with the preset highlighting rules for the most common problems.
Bookmarks
You can set bookmarks in the main list for quicker navigation. Optionally you may add comments to your bookmarks.
Read more about Conditional Bookmarks
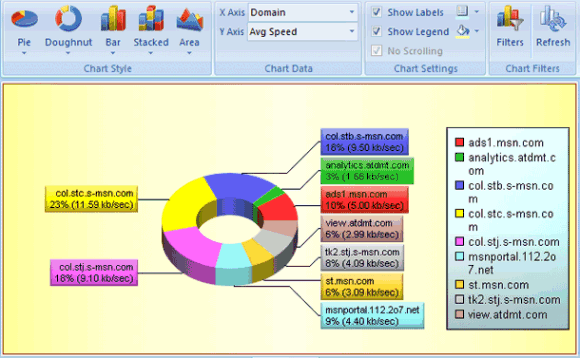
Charts and Diagrams
One of most powerful and unique features of HTTP Debugger is providing an ability to analyze the http traffic in a representative form of charts and diagrams. The HTTP Debugger comes with 20 types of diagrams. For each Diagram Type you may choose what data should be represented on the chart, this includes domain name, content type, status code; item count, data size, average speed, etc.
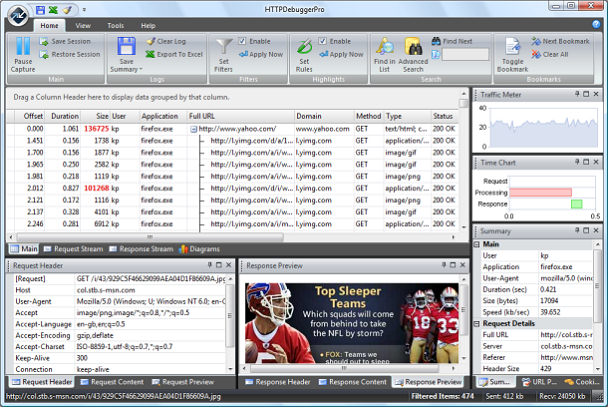
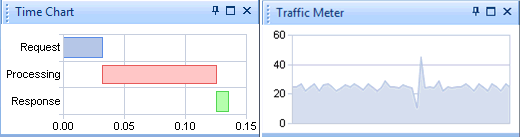
Real-time Charts
Using the Traffic Meter allows you to see HTTP traffic dynamics. The Time Chart allows you to see the time spent to send the HTTP Request to the server, the time spent by server for processing your request, and the time spent to receive the HTTP response.
Save and Restore Sessions
Sometimes reproducing a bug may take several days. The location of the problem source may take even more. With HTTP Debugger you may save your current session to a file and return to your work in few days. After restoring you will have absolutely the same data as at the time you saved it. Moreover, your users may send you the saved sessions as bug evidence. You may save as many sessions as you want.
Exporting Captured Data
You can save all captured HTTP/HTTPS traffic to a log file. You can export a single HTTP transaction, only HTTP headers or complete HTTP traffic including the HTTP content files. HTTP Debugger also allows exporting data directly to the Microsoft Excel.
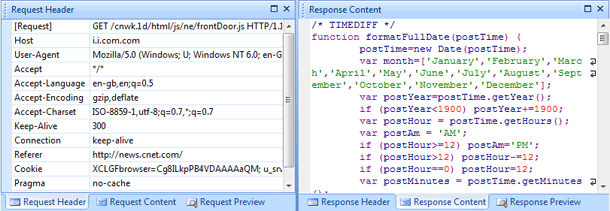
HTTP Request and Response Detailed View
For each captured HTTP transaction, the HTTP Debugger provides comprehensive information on HTTP Request/Response Header parameters, POST data, cookies, etc. The build-in editor provides syntax highlighting for all common file types, including HTML, XML, CSS, JavaScript, etc. You can preview the captured images, Flash movies directly in the HTTP Debugger Preview Pane.
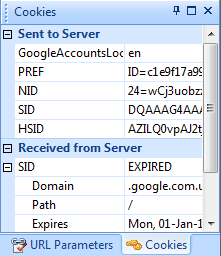
Extended Cookie and URL Parameters
HTTP Debugger automatically decodes the URL parameters and Cookies data showing them in the intuitive tabular format. With HTTP Debugger you can see the cookie's associated domains, paths, session IDs, expiration dates and other information that is sent or received from the web server.
Build-in HTTP Submitter and URL/Text Converter
Using the Built-in HTTP submitter you can simulate any HTTP request to your web server. You can emulate any HTTP method, such as GET, POST, DELETE, etc.; any user agent, such as Internet Explorer, Mozilla Firefox, Google Bot, etc; add custom HTTP header and POST parameters to your request, set authorization headers and upload files to your server. The Built-in URL/Text Converter allows an easy decoding/encoding of the URL, Base64, or Hex encoded text and/or a file.