HTTP Debugger Manual
Quick Links
OverviewDownload and Installation
Start / Stop Capture Process
Main Data Grid
Working With Data
Built-In Text Editor
Views
Filters
Highlights
Bookmarks
Search
Panes
Charts and Diagrams
Sessions
Tools
Log Files
Uninstalling
Hot Keys
HTTP Debugger is a professional http sniffer and http
analyzer for IT professionals for intercepting, viewing and analyzing the HTTP and HTTPS
protocol traffic between a web browser or any application using the HTTP/HTTPS protocol, and a
web server.
http://www.httpdebugger.com/download.html
The trial version of HTTP Debugger works without limitations for 14-days from the moment that you install it onto your computer. When the trial period runs out, you can register the program in order to continue its use.

To continue the capturing process, simply click the Start Capture button on the Toolbar or restart the operation. HTTP Debuggervides complete information about every intercepted HTTP request and response.
HTTP Debugger has two presentation forms for the main grid; flat view mode and tree view mode. You can switch between these modes by selecting the View tab on the toolbar and then clicking on the List Mode button on the toolbar.
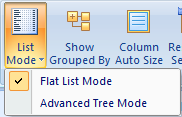
Flat view mode

Tree view mode

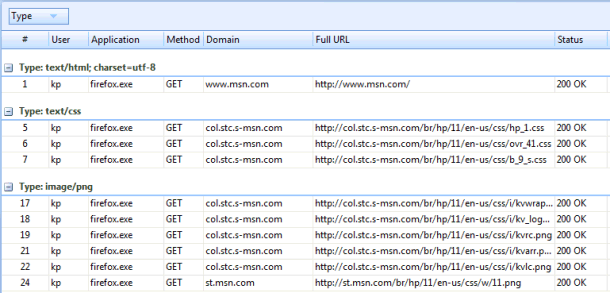
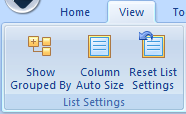
Drag the Column Header to the Group By box to group data under this parameter. To remove the grouping, drag the column header back to the list or click on the Reset List Settings button on the toolbar or press Ctrl+D. If you don’t use the grouping and want to save some space on the HTTP Debugger screen you can hide the Group By box by clicking on Show Grouped By button on the toolbar or press Ctrl+G.


If you want to remove a column from the list, simply drag the column header off the program window. To restore the default order and/or removed columns, click on the Reset List Settings button on the toolbar or press Ctrl+D.
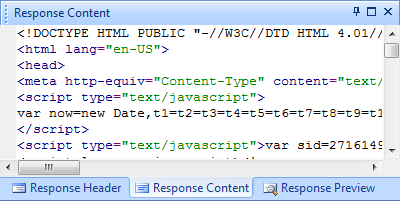
The HTTP Debugger text editor supports standard editor functions (Find/Copy/Select All, etc).
By default the HTTP Debugger text editor does not wrap long strings. If you want to enable the text wrapping (remove the horizontal scrolling bar) click on Wrap Text context menu item or press Ctrl+W on the keyboard.
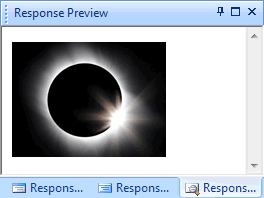
While viewing an HTML web page the HTTP Debugger may try to download the embedded web page images from the server. Please make sure that HTTP Debugger is not blocked by your firewall if you want to view web pages in HTTP Debugger.


The status bar is divided into four parts:
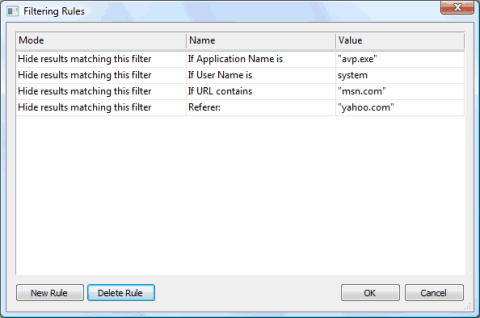
You can create a filter for any parameter of the HTTP header. The most important parameter names have already been added to HTTP Debugger, but if you cannot see the necessary parameter name in the list, simply type it in to the corresponding box. The parameter name must not contain spaces, commas, or other punctuation marks and must end with a colon.
If you cannot remember the parameter's exact name, then you can select Any place in header.
While adding a filter you have two options:
For example, if you want to see the HTTP traffic only from the MSN.com web site, you can select If URL contains for the parameter name, and type 'msn.com' for the parameter value. The HTTP traffic from all other domains will be ignored.
HTTP Debugger stores all your filters in the registry. This means that your rules stay consistent between program runs and you do not need to create them each time you start the program. To temporary disable filters without deleting them, unmark the corresponding checkbox on the toolbar.

To open the filters dialog click on the Set Filters button on the toolbar or press F5.
To apply your newly added/updated filters to all the existing data in HTTP Debugger, simply click on Apply Now on the toolbar.

Important: Please note, if you create filters that are too complex, it is possible that all the HTTP traffic will be filtered and nothing will be shown in the HTTP Debugger main screen (you can see the number of filtered items in the status bar). In this case, please update your filters.
Read more about HTTP Filter.

Highlighting is applied to a particular cell in the row. That means that several cells in one row can be highlighted in different colors according to your rules.
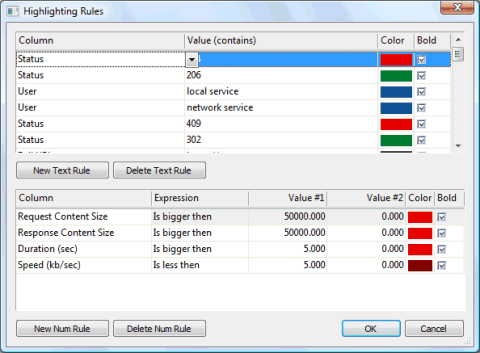
There are two options available to you:
The Text Rules can be set for a computer user name, application EXE name, HTTP method, domain name, URL, content type and status code.
The Numeral Rules can be set for HTTP header and content sizes, duration and speed.
For example, you can create a rule to mark red all web pages that are downloaded in more than five seconds, and another rule to mark green all web pages that are downloaded in less than 0.1 seconds. Or you can create a rule to mark red all web pages that return error code 404.
HTTP Debugger comes with preset highlighting rules for the most common problems. HTTP Debugger stores all your highlighting rules in the registry. This means that your rules stay consistent between program runs and you do not need to create them each time you start the program. To temporarily disable highlighting unmark the corresponding checkbox on the toolbar.

To open the highlighting rules dialog click on the Set Rules button on the toolbar or press F8.
To apply your newly added/updated rules to all existing data in HTTP Debugger, simply click on Apply Now on the toolbar.
Read more about Highlighting

Read more about Conditional Bookmarks
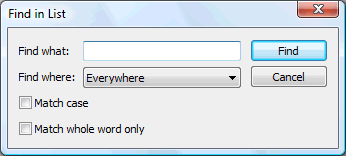
In this case, you can use the built-in search feature to quickly locate what you want. Simply click on Find in List on the toolbar or press Ctrl+F, type the text you want to locate, select the search parameters and click on Find. To continue the search, simply click on Find Next on toolbar or press F3.
The Simple Search only searches text that exists in the program’s main list. If you want to perform a search inside of the HTTP headers and content, use the Advanced Search.
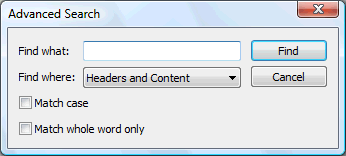
The search will be performed both in textual and binary HTTP header and content data.

The Quick Find searches only the text that exists in the program’s main list. If you want to perform a search inside of the HTTP headers and content, use the Advanced Search.
Please note that Quick Find does not remove items from HTTP Debugger permanently; after clearing the Quick Find box you will see all the items in the list as before the search was performed. To quickly activate the quick find box press F7.
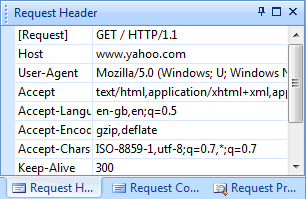
Every pane can be moved and attached to any place of the HTTP Debugger window. Simply drag the pane header to a required place.
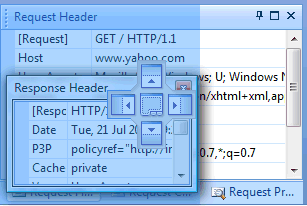
While dragging a pane, HTTP Debugger will show you arrows and highlight the places where the pane can be attached.

To resize the pane, drag the splitter bar.
You can close the pane by clicking on on the pane’s caption. By clicking on
  you can maximize the pane to the all available space. By clicking on
  you can set the option to automatically hide the pane when it is not
active. Moving the mouse over the pane’s icon will bring the pane to the front.
To restore the default layout of the panes, click on the Reset Panes button on the toolbar or press Ctrl+Y.
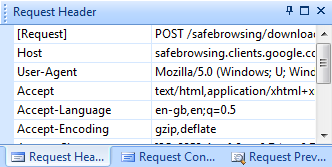
To open/hide the Request Header pane, click on the Request Header menu item on the toolbar or press Ctrl+1.
To open/hide the Request Content pane, click on the Request Content menu item on the toolbar or press Ctrl+2.
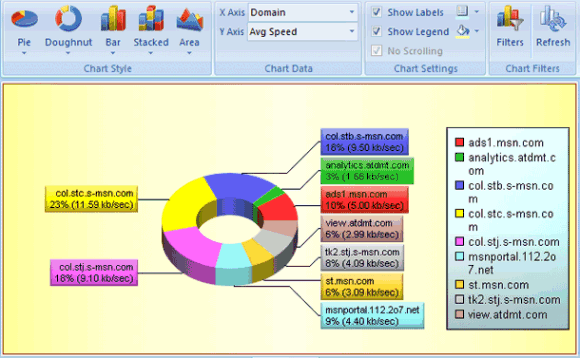
HTTP Debugger comes with 20 types of diagrams. For each diagram you may choose the chart type and its data
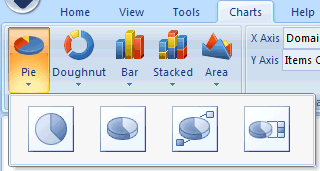
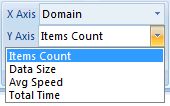
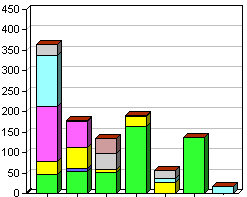
Unlike other types of diagram, the Stacked charts have two sets of data shown on the X axis.
The data in the filter’s dialog is filled automatically from the existing data from HTTP Debugger.

For example, if you have visited the Yahoo web site then the Domains combo box will contain the 'yahoo.com' domain name. If the Yahoo web site has downloaded an image from 'l.yimg.com' then this domain will also be included in the Domains combo box.

In addition, you can set two custom filters, one for HTTP request header parameters and one for HTTP response header parameters. Be careful with setting custom filters, if you set the filter too strong no data will be shown in the chart.

After restoring you will have absolutely the same data as at the time you saved it. Moreover, your users may send you the saved sessions as bug evidence. You may save as many sessions as you want.
2. Select the folder where you want to save your file.
3. Enter the name of your session file, or you may use the default one.
4. Click the Save button.
You may save as many sessions as you want.
2. Select the previously saved session file.
3. Click the Open button.
When restoring the session, the HTTP Debugger will pause capturing to avoid the data mixing.
Using the built-in HTTP submitter you can send any HTTP request with custom HTTP header parameters, HTTP method and POST parameters, send form data and upload files to your server.
Mark the Auto-Redirect checkbox if you want the HTTP Submitter to automatically handle redirects. For example, if Auto-Redirect is not enabled and you send an HTTP request to 'yahoo.com', you will receive an HTTP response with the 301 status code:
HTTP/1.1 301 Moved Permanently
Location: http://www.yahoo.com
With the enabled Auto-Redirect, when sending an HTTP request to 'yahoo.com', you will receive the HTTP header and content for the 'www.yahoo.com' web page.
Mark the Auto-Cookies checkbox if you want the HTTP Submitter to automatically send stored cookies for the requested web site. If Auto-Cookies is disabled, no cookies will be sent to the server even if they exist on your computer.
Mark the Auto-Authentication checkbox if you want the HTTP Submitter to attempt authentication automatically. This is necessary if your web server or proxy server requires authorization.
If you are connected to the Internet via a Proxy server, you can set your proxy server parameters in the 'Proxy ' dialog.
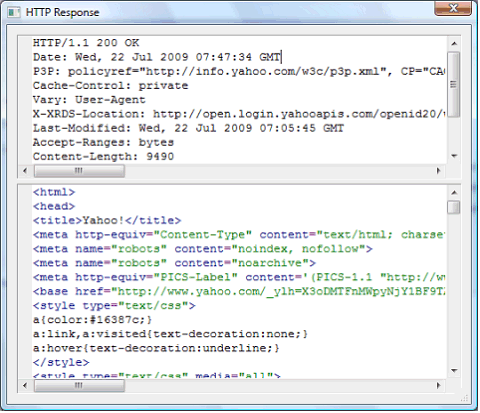
After successfully submitting an HTTP request to the web server, you will receive a popup with the HTTP response details.
The built-in editor will automatically highlight the syntax for common file types (HTML, XML, JScript, etc). The binary data will be shown in the Hex view mode.
The gzip and chunked encodings will be processed automatically.
Note: Since the HTTP Submitter sends HTTP requests and receives HTTP responses like any other network application, these requests and responses will be intercepted by the HTTP Debugger network component and will be shown in the HTTP Debugger main list. You can use the enhanced capabilities of HTTP debugger to analyze these requests and responses.
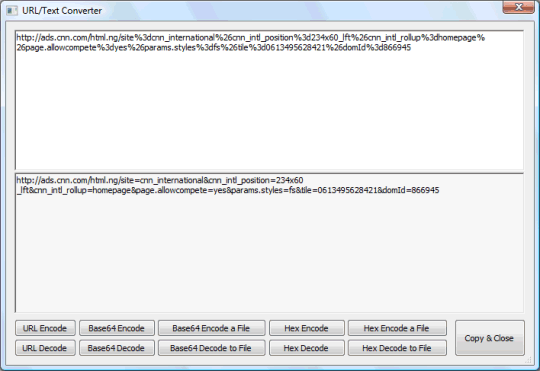
The HTTP Debugger has a built-in URL/Text Converter that allows you to easily decode (encode) the URL, Base64 and Hex encoded URLs, texts and files.
Type the text that you want to encode (decode) in the top edit box and click on the appropriate button at the bottom of the dialog.
If you want to encode a file, click on the Base64 Encode a File or Hex Encode a File button, select the file in the opened window and click on Open. The encoded text will be put in the bottom edit box of the dialog.
If you want to decode the text to a file, type the text in the top margin and click on the Base64 Decode to File or Hex Decode to File button, type in the file name and click on Save.
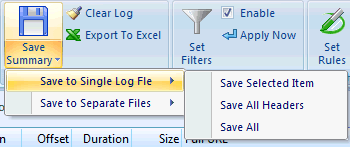
HTTP Debugger processes and removes chunked and GZIP encodings before saving the HTTP content data.
Save Selected Item – saves a single HTTP transaction into a log file.
If the HTTP content files contain images, flash movies or any other binary data then you will need a hex viewer to open the log file; or otherwise use the Notepad.
Save All Headers – saves all captured HTTP headers into a log file. The HTTP transactions are exported in the same order as they are captured. The log file can be opened in the Notepad.
Save All – saves all captured traffic into a log file. The HTTP transactions are exported in the same order as they are captured. This file can contain binary data: images, flash movies etc and you will need a hex viewer to open it.
Save All – saves all captured traffic into number of separate files (four files per HTTP transaction). These files are numerated in the same order as they are numerated in the program’s main list.
The content file extensions (.jpeg, .html, etc) are determined from the Content-Type parameter retrieved from the HTTP header; otherwise the default '.log' extension is used.

To change the HTTP Debugger theme, click the View tab in the Toolbar and then click the Theme button.
Switching the themes has no effect on functionality and performance, and can therefore be done at any time.
In the window opened, double click on Add/Remove Programs. Select HTTP Debugger in the list of installed programs and then click on Change/Remove. To finish uninstalling you will need to reboot your computer.
If the Text Editor is Active
Download
FREE 7-Day Trial
Download and Installation
The HTTP Debugger Free 14-day trial version can be downloaded from:http://www.httpdebugger.com/download.html
The trial version of HTTP Debugger works without limitations for 14-days from the moment that you install it onto your computer. When the trial period runs out, you can register the program in order to continue its use.
Start / Stop Capture
HTTP Debugger starts the capturing process right after the launching. It intercepts the HTTP traffic from all programs and all TCP/IP ports. You can temporary stop the intercepting process by clicking on the Pause Capture button on the toolbar.
To continue the capturing process, simply click the Start Capture button on the Toolbar or restart the operation. HTTP Debuggervides complete information about every intercepted HTTP request and response.
Main Data Grid
Flat and Tree List ModesHTTP Debugger has two presentation forms for the main grid; flat view mode and tree view mode. You can switch between these modes by selecting the View tab on the toolbar and then clicking on the List Mode button on the toolbar.

Flat view mode

Tree view mode

Working With Data
Grouping Data
With HTTP Debugger you can group the captured data under various parameters. For example, you can group data by domain name, content type, status code etc.
Drag the Column Header to the Group By box to group data under this parameter. To remove the grouping, drag the column header back to the list or click on the Reset List Settings button on the toolbar or press Ctrl+D. If you don’t use the grouping and want to save some space on the HTTP Debugger screen you can hide the Group By box by clicking on Show Grouped By button on the toolbar or press Ctrl+G.
Sorting Data
You can sort the data in the list by clicking on the appropriate column header. To remove the sorting, click on the Reset List Settings button on the toolbar or press Ctrl+D.
Moving and Removing Columns
If you want to move the column (change the column’s order), drag the column header to a new place in the list.
If you want to remove a column from the list, simply drag the column header off the program window. To restore the default order and/or removed columns, click on the Reset List Settings button on the toolbar or press Ctrl+D.
Column Auto-Size
You can set HTTP Debugger to automatically adjust the column widths by clicking on the Column Auto Size button on the toolbar or pressing Ctrl+I.Reset List Settings
If you have removed a column, changed the order or size of columns, want to remove grouping or simply want to restore the default layout of the list, click on the Reset List Settings button on the toolbar or press Ctrl+D. This only affects the layout of the list and does not change the list’s data.
Built-In Text Viewers with Syntax Highlighting
HTTP Debugger comes with a built-in text editor which supports syntax highlighting for common file types; HTML, CSS, XML, JScript, etc. HTTP Debugger determinates the file type based on the Content-Type parameter of the HTTP header. The binary files (images, flash, etc) are shown in the HEX view mode.
The HTTP Debugger text editor supports standard editor functions (Find/Copy/Select All, etc).
By default the HTTP Debugger text editor does not wrap long strings. If you want to enable the text wrapping (remove the horizontal scrolling bar) click on Wrap Text context menu item or press Ctrl+W on the keyboard.
Built-In Image Viewer
HTTP Debugger comes with a built-in Picture/HTML/XML/Flash viewer which is based on the Microsoft Web Browser control and supports many common file types; JPEG, GIF, PNG, HTML, XML, Flash, etc. HTTP Debugger determinates the file type based on the Content-Type parameter of the HTTP header.
While viewing an HTML web page the HTTP Debugger may try to download the embedded web page images from the server. Please make sure that HTTP Debugger is not blocked by your firewall if you want to view web pages in HTTP Debugger.
Views
The HTTP Debugger screen is divided into four different views. You can switch between the views by clicking on the corresponding tab at the bottom.
Main
The Main view shows the summary of the captured HTTP request and response data. To see the details of an item select this item from the list.Request Stream
The Request Stream shows all the details of the selected HTTP request. If a request contains binary data, images, flash, etc., then it will be presented in the HEX view mode.Response Stream
The Response Stream shows all the details of the selected HTTP response. If a response contains binary data, images, flash, etc., then it will be presented in the HEX view mode.Diagrams
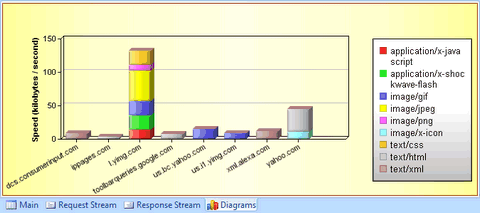
The Diagrams view shows the captured HTTP traffic in the presentable form of charts and diagrams. While switching to the Diagrams view the Charts tab is added to the toolbar allowing the chart’s style and data to be managed.
Status Bar
The status bar displays vital information about HTTP Debugger current status.
The status bar is divided into four parts:
- The first part shows HTTP Debugger current state and/or the full URL of the selected item.
- The second part shows the number of filtered items. You can press F5 to manage your filters.
- The third part shows the total size of the sent data including the size of the HTTP request headers, form data, uploaded files, etc.
- The fourth part shows the total size of the received data including the size of the HTTP response headers, received HTML, downloaded images and files, etc.
Filters
You can set filters to reduce the amount of information shown in the HTTP Debugger main screen. For example, you can set a filter to show the HTTP traffic from a particular web site only, or to monitor only the selected program, hide all images and much more.
You can create a filter for any parameter of the HTTP header. The most important parameter names have already been added to HTTP Debugger, but if you cannot see the necessary parameter name in the list, simply type it in to the corresponding box. The parameter name must not contain spaces, commas, or other punctuation marks and must end with a colon.
If you cannot remember the parameter's exact name, then you can select Any place in header.
While adding a filter you have two options:
- Show only results matching your filer.
- Hide results matching your filer.
For example, if you want to see the HTTP traffic only from the MSN.com web site, you can select If URL contains for the parameter name, and type 'msn.com' for the parameter value. The HTTP traffic from all other domains will be ignored.
HTTP Debugger stores all your filters in the registry. This means that your rules stay consistent between program runs and you do not need to create them each time you start the program. To temporary disable filters without deleting them, unmark the corresponding checkbox on the toolbar.

To open the filters dialog click on the Set Filters button on the toolbar or press F5.
To apply your newly added/updated filters to all the existing data in HTTP Debugger, simply click on Apply Now on the toolbar.

Important: Please note, if you create filters that are too complex, it is possible that all the HTTP traffic will be filtered and nothing will be shown in the HTTP Debugger main screen (you can see the number of filtered items in the status bar). In this case, please update your filters.
Read more about HTTP Filter.
Highlights
Highlighting is one of the most and unique and powerful features of HTTP Debugger. With Highlighting you can mark your web pages that perform slowly or are too big, pages that return unexpected error codes or content types, mark your browser redirects etc.
Highlighting is applied to a particular cell in the row. That means that several cells in one row can be highlighted in different colors according to your rules.

There are two options available to you:
- Textual rules for strings.
- Numeral rules for numbers.
The Text Rules can be set for a computer user name, application EXE name, HTTP method, domain name, URL, content type and status code.
The Numeral Rules can be set for HTTP header and content sizes, duration and speed.
For example, you can create a rule to mark red all web pages that are downloaded in more than five seconds, and another rule to mark green all web pages that are downloaded in less than 0.1 seconds. Or you can create a rule to mark red all web pages that return error code 404.
HTTP Debugger comes with preset highlighting rules for the most common problems. HTTP Debugger stores all your highlighting rules in the registry. This means that your rules stay consistent between program runs and you do not need to create them each time you start the program. To temporarily disable highlighting unmark the corresponding checkbox on the toolbar.

To open the highlighting rules dialog click on the Set Rules button on the toolbar or press F8.
To apply your newly added/updated rules to all existing data in HTTP Debugger, simply click on Apply Now on the toolbar.
Read more about Highlighting
Bookmarks
You can bookmark items in the program’s main list to quickly navigate to them in the feature. Optionally you may add comments to your bookmarks. To add bookmark, click on Home tab, and then click on the Toggle Bookmark on the toolbar or press Ctrl+F2. To navigate through bookmarks, click on Next Bookmark on toolbar or press F2. To clear all bookmarks click on Clear All on toolbar.
Read more about Conditional Bookmarks
Search
Simple Search
After working for a while, the program window may contain hundreds of items making it hard to find a particular HTTP request or response.
In this case, you can use the built-in search feature to quickly locate what you want. Simply click on Find in List on the toolbar or press Ctrl+F, type the text you want to locate, select the search parameters and click on Find. To continue the search, simply click on Find Next on toolbar or press F3.
The Simple Search only searches text that exists in the program’s main list. If you want to perform a search inside of the HTTP headers and content, use the Advanced Search.
Advanced Search
If you want to find an HTTP request or response that contains some text inside of its header or content you may use the Advanced Search feature. Click on Advanced Search on the toolbar or press Ctrl+Shift+F, type the text you want to locate, select where you want to perform the search and click on Find. To continue the search, simply click on Find Next on toolbar or press F3 on the keyboard.
The search will be performed both in textual and binary HTTP header and content data.
Quick Find
To quickly locate an HTTP request or response containing the search text, type this text into the Quick Find box on toolbar. Only HTTP requests or responses containing the search text will be shown in the list. For example, type 'text/css' into the box to locate all the stylesheets in the list.
The Quick Find searches only the text that exists in the program’s main list. If you want to perform a search inside of the HTTP headers and content, use the Advanced Search.
Please note that Quick Find does not remove items from HTTP Debugger permanently; after clearing the Quick Find box you will see all the items in the list as before the search was performed. To quickly activate the quick find box press F7.
Panes
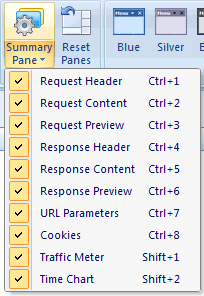
HTTP Debugger has eleven panes that show a variety of vital information about selected HTTP transactions (HTTP request and response pairs).
Every pane can be moved and attached to any place of the HTTP Debugger window. Simply drag the pane header to a required place.

While dragging a pane, HTTP Debugger will show you arrows and highlight the places where the pane can be attached.

To resize the pane, drag the splitter bar.
You can close the pane by clicking on
 on the pane’s caption. By clicking on
  you can maximize the pane to the all available space. By clicking on
  you can set the option to automatically hide the pane when it is not
active. Moving the mouse over the pane’s icon will bring the pane to the front.
To restore the default layout of the panes, click on the Reset Panes button on the toolbar or press Ctrl+Y.
Request Header Pane
HTTP Debugger automatically processes and shows all the HTTP request header parameters in the Request Header pane in an easy to understand tabular format.
To open/hide the Request Header pane, click on the Request Header menu item on the toolbar or press Ctrl+1.
Request Content Pane
In the Request Content pane you can view sent form data, POST parameters and uploaded files. The built-in editor will automatically highlight the syntax for common file types (HTML, XML, JScript, etc). The binary data will be shown in the Hex view mode. The gzip and chunked encodings will be processed automatically.To open/hide the Request Content pane, click on the Request Content menu item on the toolbar or press Ctrl+2.
Request Preview Pane
In the Request Preview pane you can view uploaded images, XML and HTML files, etc. To open/hide the Request Preview pane, click on the Request Preview menu item on the toolbar or press Ctrl+3.Response Header Pane
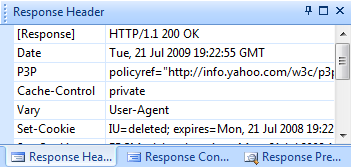
HTTP Debugger automatically processes and shows all the HTTP response header parameters in the Response Header pane in an easy to understand tabular format. To open/hide the Response Header pane, click on the Response Header menu item on the toolbar or press Ctrl+4.
Response Content Pane
In the Response Content pane you can view downloaded web pages, XML files, images, etc. The built-in editor will automatically highlight the syntax for the common file types (HTML, XML, JScript, etc). The binary data will be shown in the Hex view mode. The gzip and chunked encodings will be processed automatically. To open/hide the Response Content pane, click on the Response Content menu item on the toolbar or press Ctrl+5.Response Preview Pane
In the Response Preview pane you can view downloaded images, XML and HTML files, etc. To open/hide the Response Preview pane, click on the Response Preview menu item on the toolbar or press Ctrl+6.URL Parameters Pane
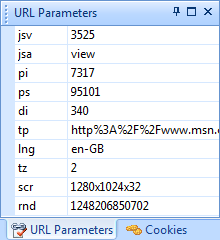
HTTP Debugger automatically decodes URL parameters and shows them in the URL Parameters pane in an easy to understand tabular format. To open/hide the URL Parameters pane, click on the URL Parameters menu item on the toolbar or press Ctrl+7.
Cookies Pane
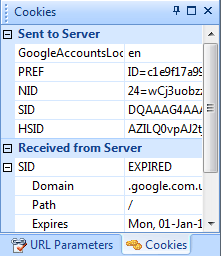
In the Cookies pane you can view full details of web page cookies. This information includes cookie’s associated domains, paths, session IDs, expiration dates and other information that is sent or received from the web server. HTTP Debugger automatically decodes cookie’s parameters and shows them in an easy to understand tabular format. To open/hide the Cookies pane, click on the Cookies menu item on the toolbar or press Ctrl+8.
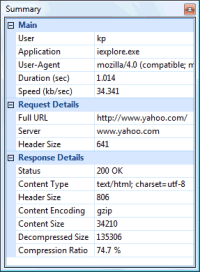
Summary Pane
The Summary pane enables you to quickly get detailed information about a particular request and/or response. This information includes: user name, program name, server name, referrer, status code, downloading time and speed, etc. In the Summary pane you can view the compression details (encoding method, compression ratio, etc) for your compressed web pages. To open/hide the Summary pane, click on the Summary pane button on the toolbar or press F4.
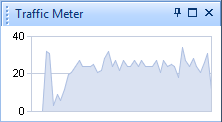
Traffic Meter
The Traffic Meter pane shows your HTTP traffic dynamics. It includes both outgoing and incoming HTTP data. The Traffic Meter updates its screen about once a second. It presents data for about the last 12 seconds. The Traffic Meter automatically scales its Y axis depending on your Internet speed and the web server performance. The data presented is in kilobytes. To open/hide the Traffic Meter pane, click on the Traffic Meter menu item on the toolbar or press Shift+1.
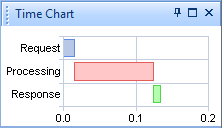
Time Chart
The Time Chart allows you to see the time spent to send the particular HTTP Request to the server, the time spent by the server for processing this request, and the time spent to receive the HTTP response from the server. These times depend on your network latency, the web server performance and the size and complexity of your web pages and scripts. The times are shown in seconds. To open/hide the Time Chart pane, click on the Time Chart menu item on the toolbar or press Shift+2.
Reset Panes Layout
If you have closed a pane you can open it again by clicking on the appropriate menu item or pressing its hot key. If you want to restore the default panes layout click on the Reset Panes button on the toolbar or press Ctrl+Y.
Charts and Diagrams
One of most powerful and unique features of HTTP Debugger is providing an ability to analyze the http traffic in a reprehensive form of charts and diagrams.
HTTP Debugger comes with 20 types of diagrams. For each diagram you may choose the chart type and its data
Chart Type
To set the Chart Type, click on the appropriate icon on the toolbar (Pie, Doughnut, Bar, etc) and select the chart type from the popup window that opens.
Chart Data
Each chart type has its own set of data that it can show. After selecting the chart type you can set what data will be shown on the chart’s X and Y axes.
Unlike other types of diagram, the Stacked charts have two sets of data shown on the X axis.

Chart Settings
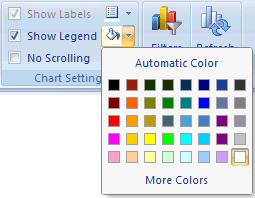
Depending on the chart type, you may set the chart’s background color, show/hide chart labels and the chart legend.
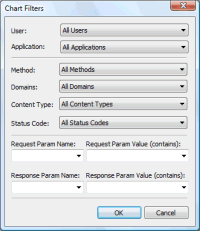
Chart Filters
In addition to the standard HTTP Debugger filters you can set filters to reduce the amount of data shown in the chart. These chart filters do not delete the data from HTTP Debugger and do not affect the data shown in the program’s main list.
The data in the filter’s dialog is filled automatically from the existing data from HTTP Debugger.

For example, if you have visited the Yahoo web site then the Domains combo box will contain the 'yahoo.com' domain name. If the Yahoo web site has downloaded an image from 'l.yimg.com' then this domain will also be included in the Domains combo box.

In addition, you can set two custom filters, one for HTTP request header parameters and one for HTTP response header parameters. Be careful with setting custom filters, if you set the filter too strong no data will be shown in the chart.
Updating Chart
While switching to the Diagrams tab, resizing the HTTP Debugger window or setting the chart filters, the charts are generated and updated automatically. If you want to manually update the chart, click on the Refresh utton on the toolbar.
Sessions
Sometimes reproducing a bug may take several days. The location of the problem source may take even more. With HTTP Debugger you may save your current session to a file and return to your work in few days.After restoring you will have absolutely the same data as at the time you saved it. Moreover, your users may send you the saved sessions as bug evidence. You may save as many sessions as you want.

Save Session
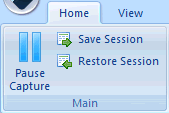
1. Click the Save Session button on the toolbar; alternatively you can press Ctrl+Alt+S.2. Select the folder where you want to save your file.
3. Enter the name of your session file, or you may use the default one.
4. Click the Save button.
You may save as many sessions as you want.
Restore Session
1. Click on the Restore Session button on the toolbar; alternatively you can press Ctrl+Alt+R.2. Select the previously saved session file.
3. Click the Open button.
When restoring the session, the HTTP Debugger will pause capturing to avoid the data mixing.
Tools
HTTP Submitter
Sometimes for testing and debugging purposes it is necessary to send a custom HTTP request to the web server with specified parameters.
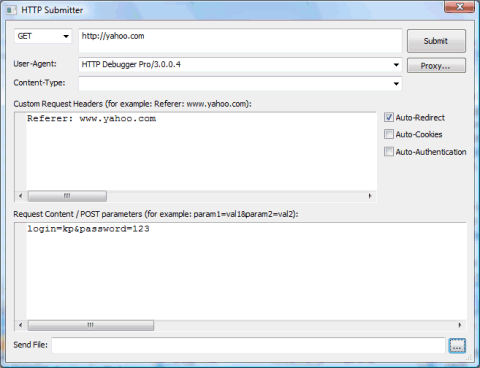
Using the built-in HTTP submitter you can send any HTTP request with custom HTTP header parameters, HTTP method and POST parameters, send form data and upload files to your server.
Mark the Auto-Redirect checkbox if you want the HTTP Submitter to automatically handle redirects. For example, if Auto-Redirect is not enabled and you send an HTTP request to 'yahoo.com', you will receive an HTTP response with the 301 status code:
HTTP/1.1 301 Moved Permanently
Location: http://www.yahoo.com
With the enabled Auto-Redirect, when sending an HTTP request to 'yahoo.com', you will receive the HTTP header and content for the 'www.yahoo.com' web page.
Mark the Auto-Cookies checkbox if you want the HTTP Submitter to automatically send stored cookies for the requested web site. If Auto-Cookies is disabled, no cookies will be sent to the server even if they exist on your computer.
Mark the Auto-Authentication checkbox if you want the HTTP Submitter to attempt authentication automatically. This is necessary if your web server or proxy server requires authorization.
If you are connected to the Internet via a Proxy server, you can set your proxy server parameters in the 'Proxy ' dialog.

After successfully submitting an HTTP request to the web server, you will receive a popup with the HTTP response details.
The built-in editor will automatically highlight the syntax for common file types (HTML, XML, JScript, etc). The binary data will be shown in the Hex view mode.
The gzip and chunked encodings will be processed automatically.
Note: Since the HTTP Submitter sends HTTP requests and receives HTTP responses like any other network application, these requests and responses will be intercepted by the HTTP Debugger network component and will be shown in the HTTP Debugger main list. You can use the enhanced capabilities of HTTP debugger to analyze these requests and responses.
Auto-responder allows to simulate a server response with a custom http header and content.
HTTP Modifier allows to modify the HTTP traffic on the fly.
TCP/IP Redirector allows to redirect TCP/IP connections transparently from one IP address / port to another.
URL/Text Converter
Sometimes it is necessary to quickly encode a URL with unsafe characters or decode a URL with 'escape' characters ('escape' characters start with a % and 2-digit code, for example %23 = #, %20 = blank).
The HTTP Debugger has a built-in URL/Text Converter that allows you to easily decode (encode) the URL, Base64 and Hex encoded URLs, texts and files.
Type the text that you want to encode (decode) in the top edit box and click on the appropriate button at the bottom of the dialog.
If you want to encode a file, click on the Base64 Encode a File or Hex Encode a File button, select the file in the opened window and click on Open. The encoded text will be put in the bottom edit box of the dialog.
If you want to decode the text to a file, type the text in the top margin and click on the Base64 Decode to File or Hex Decode to File button, type in the file name and click on Save.
Minimizing to the System Tray
By default, HTTP Debugger is minimized to the System Tray. If you want to minimize the HTTP Debugger to the task bar, then unmark Minimize to Tray item in the context menu.
Log Files
You can save the captured traffic to the disk to analyze them latter or to have a copy of the intercepted data.
HTTP Debugger processes and removes chunked and GZIP encodings before saving the HTTP content data.
Save to Single Log File
Save Summary – saves the HTTP traffic summary as a comma separated (*.CSV) file.Save Selected Item – saves a single HTTP transaction into a log file.
If the HTTP content files contain images, flash movies or any other binary data then you will need a hex viewer to open the log file; or otherwise use the Notepad.
Save All Headers – saves all captured HTTP headers into a log file. The HTTP transactions are exported in the same order as they are captured. The log file can be opened in the Notepad.
Save All – saves all captured traffic into a log file. The HTTP transactions are exported in the same order as they are captured. This file can contain binary data: images, flash movies etc and you will need a hex viewer to open it.
Save to Separate Files
Save Selected Item – saves a single HTTP transaction into four separate files (request header, request content, response header and response content).Save All – saves all captured traffic into number of separate files (four files per HTTP transaction). These files are numerated in the same order as they are numerated in the program’s main list.
The content file extensions (.jpeg, .html, etc) are determined from the Content-Type parameter retrieved from the HTTP header; otherwise the default '.log' extension is used.
Exporting to Microsoft Excel
The summary of captured HTTTP traffic can be exported directly to the Microsoft Excel, if it is installed on your computer, by clicking the Export to Excel button on the toolbar; alternatively you can press Ctrl+E.Clearing Logs
To clear all data, click the Clear Log button on the toolbar; alternatively you can press Ctrl+L.UI Themes
HTTP Debugger is supplied with three different user interface themes: blue, silver and black.
To change the HTTP Debugger theme, click the View tab in the Toolbar and then click the Theme button.
Switching the themes has no effect on functionality and performance, and can therefore be done at any time.
Uninstalling
The uninstalling procedure for HTTP Debugger does not differ from the standard operation to remove any program from the Windows operation system. To remove HTTP Debugger from your computer, click on Start, and then select Settings and then Control Panel.In the window opened, double click on Add/Remove Programs. Select HTTP Debugger in the list of installed programs and then click on Change/Remove. To finish uninstalling you will need to reboot your computer.
Hot Keys
| Ctrl + L | Clear Log |
| Ctrl + E | Export to Excel |
| Ctrl + F | Find in List |
| Ctrl + Shift + F | Advanced Find |
| F3 | Find Next |
| F7 | Activate Quick Find box |
| Ctrl + F2 | Toggle Bookmark |
| F2 | Next Bookmark |
| Ctrl + Alt + S | Export Session |
| Ctrl + Alt + R | Import Session |
| F5 | Set Filtering Rules |
| Ctrl + F5 | Enable/disable Filters |
| Alt + F5 | Apply Filters Now |
| F8 | Set Highlighting Rules |
| Ctrl + F8 | Enable/disable Highlighting |
| Alt + F8 | Apply Highlighting Now |
| Ctrl + P | Start/pause Capture |
| Ctrl + I | Set Column Auto Size |
| Ctrl + G | Show/hide Grouped By |
| F4 | Show/hide Summary Pane |
| Ctrl + 1 | Show/hide Request Header Pane |
| Ctrl + 2 | ShowShow/hide Request Content Pane |
| Ctrl + 3 | Show/hide Request Preview Pane |
| Ctrl + 4 | Show/hide Response Header Pane |
| Ctrl + 5 | Show/hide Response Content Pane |
| Ctrl + 6 | Show/hide Response Preview Pane |
| Ctrl + 7 | Show/hide URL Parameters Pane |
| Ctrl + 8 | Show/hide Cookies Pane |
| Shift + 1 | Show/hide Traffic Meter Pane |
| Shift + 2 | Show/hide Time Chart Pane |
| Ctrl + Y | >Reset Panes |
| Ctrl + D | Reset List Settings |
If the Text Editor is Active
| Ctrl + F | Find Text |
| F3 | Find Next |
| Ctrl + W | Wrap Text |
| Ctrl + C | Copy Text |
| Ctrl + V | Paste Text |
| Ctrl + A | Select all Text |


