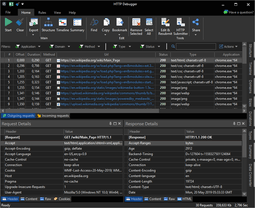
HTTP Debugger Pro is a powerful Fiddler alternative for Windows. It shows real HTTP and HTTPS traffic from your web applications, APIs, microservices, and desktop apps in a clean, user-friendly interface.
With HTTP Debugger Pro, you don't need to run a local proxy server on your computer and interfere with the normal operation of the system by changing proxy servers.
HTTP Debugger Pro gives you instant visibility into all HTTP/HTTPS traffic so you can intercept, inspect, and troubleshoot requests and responses with zero setup and no proxy overhead.
Why many teams move beyond classic proxy-based debuggers
Fiddler and other HTTP debugging proxies have been around for years. But on Windows, they often add extra friction that has nothing to do with the problem you’re actually trying to solve.
- 1) System-wide proxy changes that may conflict with corporate proxies, VPN clients, or PAC files.
- 2) If an application does not support using an HTTP proxy, proxy-based tools cannot capture its traffic.
- 3) Proxy-based HTTP sniffers may miss traffic from applications that were started before the proxy was enabled, because those apps might not respond to proxy change events and may continue using their original connections and settings.
- 4) Risk of breaking connectivity on the workstation when proxy settings are frequently changed during debugging sessions.
For over 15+ years, development and QA teams worldwide have relied on HTTP Debugger Pro as a proven, proxy-free alternative that delivers focused HTTP/HTTPS analysis without proxy overhead.
Meet HTTP Debugger Pro - proxy-less Fiddler alternative for Windows
HTTP Debugger Pro captures HTTP and HTTPS traffic directly from browsers and Windows applications over any network connection, including LAN, Wi-Fi, other network adapters, VPN tunnels, and applications whose traffic is already routed through an upstream or corporate proxy.
From a single HTTP Debugger Pro interface, you can:
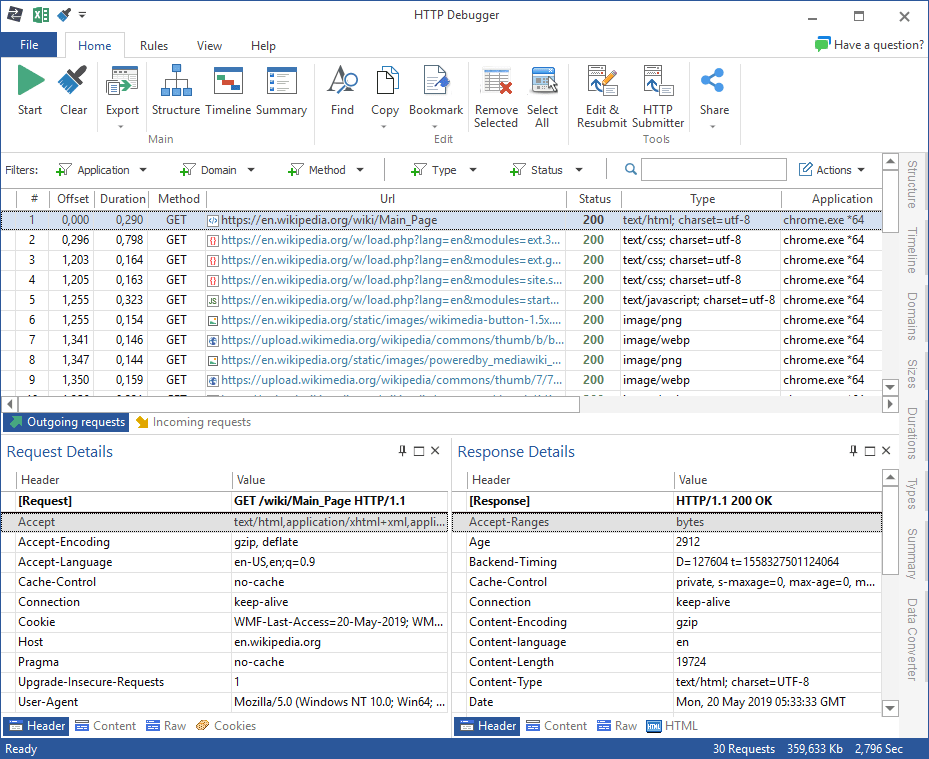
- 1) Capture and analyze HTTP headers, cookies, POST parameters, HTTP content and CORS headers from any browser or desktop application.
- 2) Debug HTTP API calls to a back-end and between back-ends in distributed systems and microservices.
- 3) See all details of each request and response: URLs, methods, status codes, timing, payload sizes, and content types.
- 4) Automatically highlight errors, slow or large requests, and apply your own highlighting rules in a single click.
- 5) Visualize traffic with charts to quickly spot the slowest endpoints, largest payloads, most requested domains, and top content types.
- 6) Edit and resend HTTP sessions to test auth flows, reproduce edge cases, and verify fixes.
- 7) Decrypt SSL/HTTPS traffic from browsers, desktop apps, Android emulators, and typical .NET/JAVA applications.
- 8) Export captured data to Excel, JSON, XML, TXT, or CSV for further analysis and reporting.
HTTP Debugger vs Fiddler
Both Fiddler and HTTP Debugger allow you to inspect and modify HTTP/HTTPS traffic. The main difference is architectural and operational:
- 1) Proxy-less vs proxy-based. HTTP Debugger is a proxy-less HTTP sniffer; it does not require configuring a system proxy in browsers or Windows settings. Fiddler is an intercepting proxy and becomes the system proxy while running.
- 2) Compatibility with existing proxies. HTTP Debugger can analyze traffic even when the application already talks through a corporate or upstream proxy; you do not have to replace it during debugging.
- 3) Stability of the environment. Because there is no proxy toggle at the OS level, HTTP Debugger is much less likely to break other applications on the workstation.
If your main goal is to debug HTTP API calls, investigate CORS and authorization problems, or understand performance issues between services, the proxy-less model tends to be simpler and safer to operate.
Where HTTP Debugger gives you the most value as a Fiddler replacement
- 1) Debugging applications that do not support working through an HTTP proxy and always connect directly to the Internet.
- 2) Performing security checks and traffic analysis for applications that were started before any proxy server was enabled on the system.
- 3) Analyzing HTTP logs from your customers' machines using the dedicated HTTP Debugger logging component.
- 4) Investigating authentication and OAuth issues. See exactly which headers, cookies, tokens, and redirects are actually sent over the network.
- 5) Finding performance bottlenecks. Use automatic highlighting and charts to pinpoint slow endpoints, large responses, and inefficient content types.
- 6) Working with Android emulators or test rigs. Decrypt and analyze HTTPS traffic from emulators and IoT-style devices without reconfiguring your entire environment just to run a proxy.
Where other HTTP debugging tools still fit
The HTTP debugging ecosystem is extensive. Depending on the task, developers, QA specialists, and security engineers use different categories of tools, including intercepting proxies (Charles Proxy, Proxyman), open-source proxies and CLI utilities (HTTP Toolkit, mitmproxy), packet analyzers for low-level inspection (Wireshark), security testing proxies (Burp Suite, OWASP ZAP), and API client applications (Postman, Insomnia). For browser-only scenarios, extensions such as HttpWatch or Requestly are often used as a lightweight complement.
When the basic features of browser dev tools, generic proxies, or low-level packet sniffers are not enough - or you want to save time and focus directly on debugging your issue - HTTP Debugger Pro is a practical choice. It is a professional, proxy-free HTTP/HTTPS traffic analyzer for Windows, primarily focused on day-to-day debugging for developers and QA engineers, helping you stay focused on fixing issues and quickly identify the root cause of HTTP-related problems.
How to switch from Fiddler to HTTP Debugger Pro in a few minutes
- 1) Download HTTP Debugger Pro and install it on the same Windows machine where you previously ran Fiddler.
- 2) Start HTTP Debugger Pro, and it will immediately begin capturing HTTP/HTTPS traffic on the system.
- 3) Run the application you want to debug (browser, API client, desktop app, emulator) and reproduce the issue.
Can Fiddler and HTTP Debugger Pro run on the same computer?
Yes. HTTP Debugger Pro uses a different approach to intercept and analyze HTTP/HTTPS traffic, allowing it to run side by side with Fiddler on the same Windows machine.
Why teams pick HTTP Debugger Pro as their Fiddler alternative
- 1) Proxy-less architecture. No proxy reconfiguration, fewer side effects, and smoother operation in complex enterprise networks.
- 2) Focused on HTTP debugging. Created by developers who work with HTTP/HTTPS daily, with workflows optimized for real-world API and web troubleshooting.
- 3) Clean UI and short ramp-up time. New team members can become productive quickly without learning a complex proxy toolchain.
- 4) Trusted worldwide. Used by thousands of companies; battle-tested across teams from small product groups to large enterprises.
Try HTTP Debugger Pro as your next Fiddler alternative
If you are ready to move from a classic proxy-based debugger to a proxy-less HTTP sniffer optimized for Windows development, HTTP Debugger Pro is a practical next step.
FAQ: HTTP Debugger Pro vs Fiddler
Is HTTP Debugger Pro a proxy server?
No. HTTP Debugger Pro is not a proxy server and does not set itself as a system proxy. It uses a different approach to capture HTTP/HTTPS traffic, which helps avoid proxy-related network issues and conflicts with corporate proxies or VPN clients.
Can Fiddler and HTTP Debugger Pro run on the same computer?
Yes. Because HTTP Debugger Pro is not a proxy and uses a different capture mechanism, it can run side by side with Fiddler on the same Windows machine.
Will HTTP Debugger Pro see traffic from applications that do not support proxies?
Yes. HTTP Debugger Pro captures HTTP/HTTPS traffic directly from browsers and Windows applications, regardless of how they connect to the Internet-whether through a proxy server or directly, without proxy support.
Does HTTP Debugger Pro work with VPNs and corporate proxies?
Yes. HTTP Debugger Pro can capture traffic over LAN, Wi-Fi, other network adapters, and VPN tunnels, and it can also monitor applications whose traffic is already routed through an upstream or corporate proxy.
Can HTTP Debugger Pro decrypt HTTPS traffic?
Yes. HTTP Debugger Pro can decrypt SSL/HTTPS traffic from typical browsers, desktop applications, Android emulators, and common .NET/JAVA applications, allowing you to see request and response bodies, headers, cookies, and parameters in clear text.
What platforms does HTTP Debugger Pro support?
HTTP Debugger Pro is designed for Windows desktops and servers and supports Windows 7, 10, and 11, both 32-bit and 64-bit.
Can HTTP Debugger Pro fully replace Fiddler in my daily work?
Yes. HTTP Debugger Pro lets you inspect and modify HTTP/HTTPS traffic from browsers, APIs, microservices, and desktop applications on Windows so that you can use it as your primary tool for day-to-day HTTP debugging instead of Fiddler.