Getting Started with HTTP Debugger
Getting Started with HTTP Debugger Pro Application
Start / Stop Capture Process
HTTP Debugger starts the capturing process right after the launching. It intercepts the HTTP traffic from all programs and all TCP/IP ports. You can temporary stop the intercepting process by clicking on the Pause Capture button on the toolbar.To continue the capturing process, simply click the Start Capture button on the Toolbar or restart the program. HTTP Debuggervides complete information about every intercepted HTTP request and response.
Flat and Tree List Modes
HTTP Debugger has two presentation forms for the main grid; flat view mode and tree view mode. You can switch between these modes by selecting the View tab on the toolbar and then clicking on the List Mode button on the toolbar.Flat view mode

Tree view mode

Bookmarks
You can bookmark items in the program’s main list to quickly navigate to them in the feature. Optionally you may add comments to your bookmarks. To add bookmark, click on Home tab, and then click on the Toggle Bookmark on the toolbar or press Ctrl+F2. To navigate through bookmarks, click on Next Bookmark on toolbar or press F2.Read more about Conditional Bookmarks
Panes
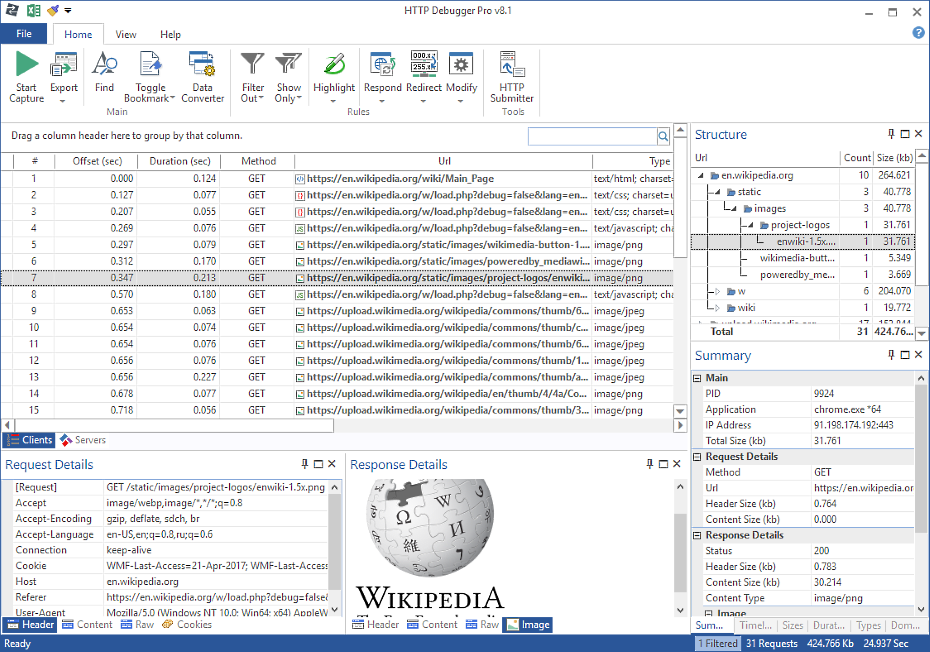
All the data is separated and presented in eleven HTTP Debugger panes. You can change the order and position of the panes according to your preferences. Simply drag the pane header to a required place.
HTTP Debugger automatically processes and shows all HTTP header parameters in an easy-to- understand tabular format. The built-in editor automatically highlights the syntax of the common file types: HTML, XML, JavaScript, etc. The binary data is shown in the Hex View mode.
Views
The HTTP Debugger screen is divided into four different views. You can switch between the views by clicking on the corresponding tab at the bottom.
The Main view shows the summary of the captured HTTP request and response data. To see the details of an item select this item from the list.
The Request Stream shows all the details of the selected HTTP request. If a request contains binary data, images, flash, etc., then it will be presented in the HEX view mode.
The Response Stream shows all the details of the selected HTTP response. If a response contains binary data, images, flash, etc., then it will be presented in the HEX view mode.
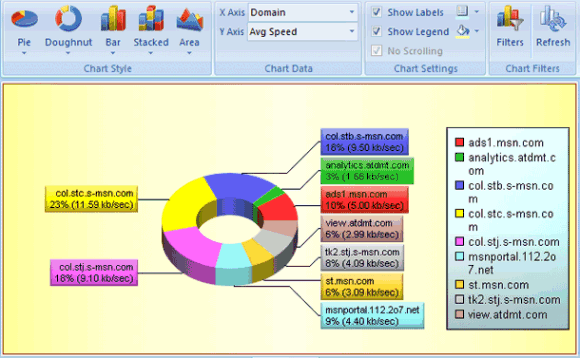
The Diagrams view shows the captured HTTP traffic in the presentable form of charts and diagrams. While switching to the Diagrams view the Charts tab is added to the toolbar allowing the chart’s style and data to be managed.

Sessions
You can save your current sessions to a file and return to your work in a few days. After restoring your session you will have the same data set as at the time you saved it. You may save as many sessions as you want.Logs
You can save the captured traffic to the disk to analyze them latter or to have a copy of the intercepted data.
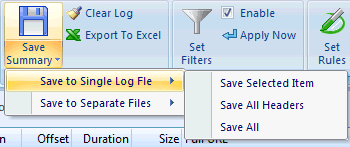
You may save the HTTP traffic summary into a comma separated (*.CSV) file, or save data into a log file, or save request header, request content, response header and response content, into four separate files. The content file extensions (.jpeg, .html, etc) are determined from the Content-Type parameter retrieved from the HTTP header.
Exporting to Microsoft Excel
The summary of captured HTTTP traffic can be exported directly to the Microsoft Excel, if it is installed on your computer, by clicking the Export to Excel button on the toolbar; alternatively you can press Ctrl+E.Clearing Logs
To clear all data, click the Clear Log button on the toolbar; alternatively you can press Ctrl+L.Filtering Data
You can set filters to reduce the amount of information shown in the HTTP Debugger main screen. For example, you can set a filter to show the HTTP traffic from a particular web site only, or to monitor only the selected program, hide all images and much more.You can create a filter for any parameter of the HTTP header. The most important parameter names have already been added to HTTP Debugger, but if you cannot see the necessary parameter name in the list, simply type it in to the corresponding box. The parameter name must not contain spaces, commas, or other punctuation marks and must end with a colon.
Highlighting Data
Highlighting is one of the most and unique and powerful features of HTTP Debugger. With Highlighting you can mark your web pages that perform slowly or are too big, pages that return unexpected error codes or content types, mark your browser redirects etc.
Highlighting is applied to a particular cell in the row. That means that several cells in one row can be highlighted in different colors according to your rules.
Read more about Highlighting
Search
After working for a while, the program window may contain hundreds of items making it hard to find a particular HTTP request or response. In this case, you can use the built-in search features to quickly locate what you want.
There are three options available to you:
The Simple Search only searches text that exists in the program’s main list.
The Advanced Search will be performed both in textual and binary HTTP header and content data.
The Quick Find filters the data in the program’s main list. It does not remove items from HTTP Debugger permanently; after clearing the Quick Find box you will see all the items in the list as before the search was performed.
Minimizing to the System Tray
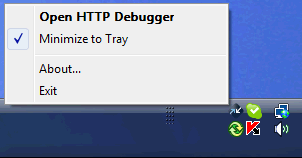
By default, HTTP Debugger is minimized to the System Tray. If you want to minimize the HTTP Debugger to the task bar, then unmark Minimize to Tray item in the context menu.
UI Themes
HTTP Debugger is supplied with three different user interface themes: blue, silver and black.
To change the HTTP Debugger theme, click the View tab in the Toolbar and then click the Theme button. Switching the themes has no effect on functionality and performance, and can therefore be done at any time.
Copyright Notice: Please don't copy or translate this article without prior written permission from the HTTPDebugger.com
Read more articles
HTTP Debugger is a proxy-less HTTP sniffer for developers that provides the ability to
capture and analyze HTTP headers,
cookies, POST params, HTTP content and CORS headers from any browser or desktop
application.
Very easy to use, with clean UI, and short ramp-up time.
Download
FREE 7-Day Trial
HTTP Debugger Pro

- See all in/out HTTP traffic, HTTP headers, cookies, POST params, HTTP content
- Isolate and fix performance bottlenecks, detect and eliminate security issues
- Very easy of use, clean UI, and short ramp-up time. Not a proxy, no network issues!


